
Public data research · 2025 source data
Colorado earnings and Social Security totals cannot describe separate households
By RetirementRiskIQ · Published
This descriptive source-data research is separate from the site’s modeled risk scores. It does not estimate individual risk or provide personalized financial advice. Definitions, uncertainty and source-year limits are included below.
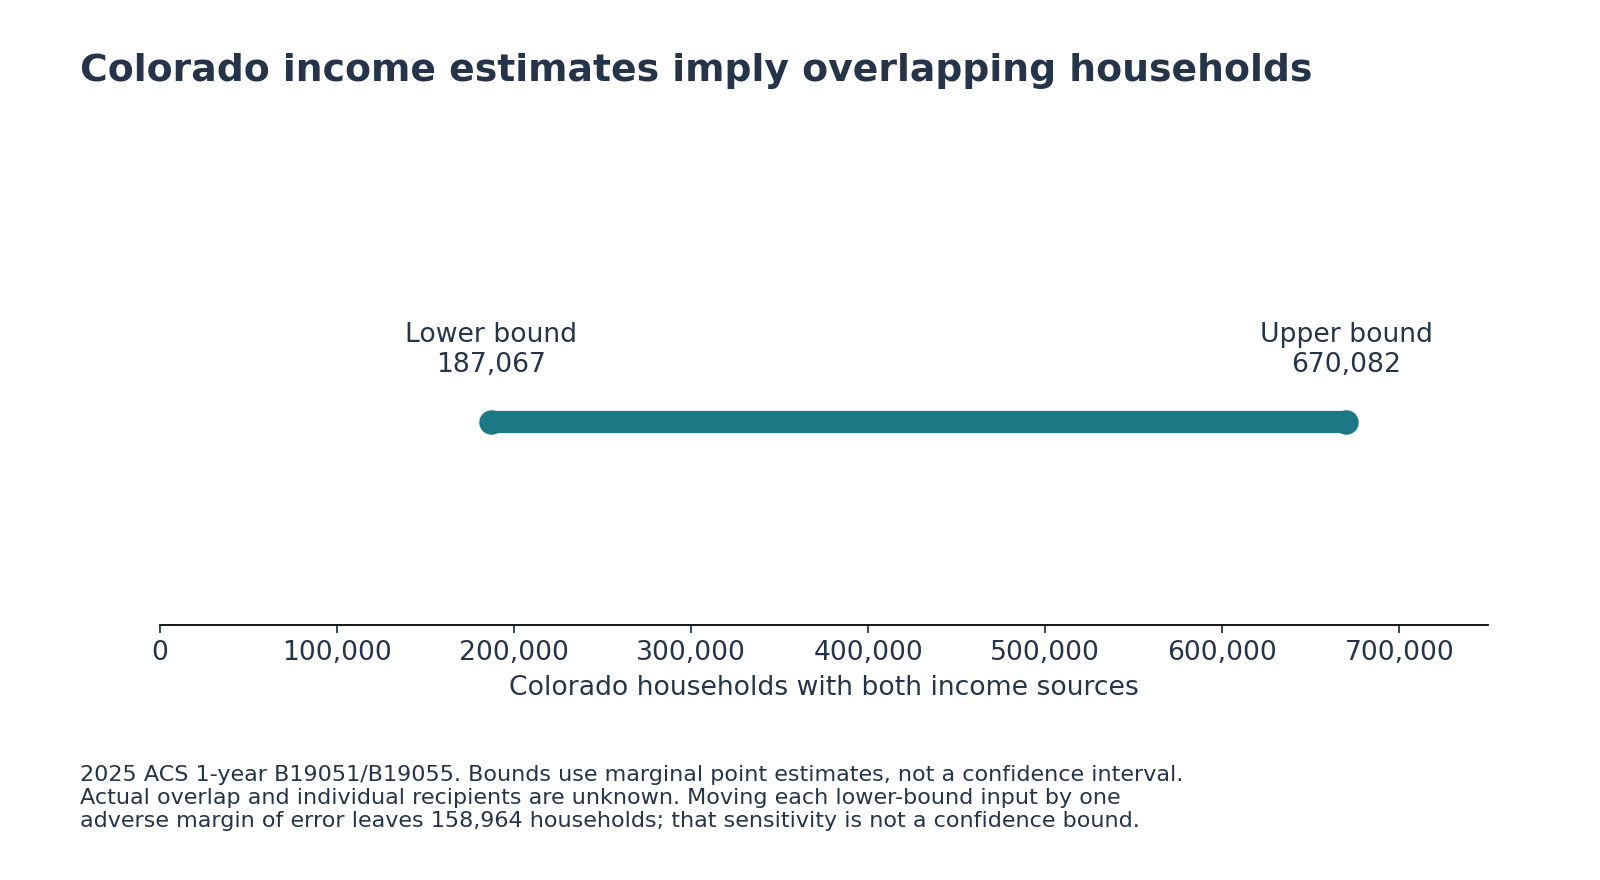
Sources, methods and downloadsThe published Colorado household income estimates cannot describe two entirely separate groups of households. The 2025 American Community Survey point estimates imply overlap: at least 187,067 Colorado households must appear in both groups.
That number is an algebraic lower bound, not a directly observed count of households receiving both sources. It also does not count individual workers drawing benefits. Earnings and Social Security income can belong to different members of the same household.
A lower bound without linking individual households
The Census Bureau estimates 2,000,127 Colorado households with earnings and 1,813,060 without Social Security income. Even if every household without Social Security had earnings, that group would still be too small to contain all households with earnings. The remainder is 187,067. Sources: Tables B19051 and B19055.
| 2025 Colorado measure | Estimate and published 90% margin of error |
|---|---|
| Households with earnings | 2,000,127 ± 14,832 |
| Households with Social Security income | 670,082 ± 9,665 |
| Households without Social Security income | 1,813,060 ± 13,271 |
| All households | 2,483,142 ± 10,139 |
The arithmetic is 2,000,127 minus 1,813,060. An equivalent calculation adds households with earnings and households with Social Security income, then subtracts all households. Neither operation identifies which households overlap.
The actual intersection implied by these marginal point estimates could range from 187,067 to 670,082 households. The upper bound is the smaller of the two receipt groups: all households reporting Social Security income. The range is deliberately wide because the two published tables do not show the joint distribution. It is not a confidence interval.
Sampling uncertainty does not disappear in arithmetic
Each input is a survey estimate. As a transparent sensitivity check, reducing the earnings estimate by its published margin of error and increasing the no-Social-Security estimate by its margin still leaves a positive difference of 158,964 households. Those two marginal adjustments are not a simultaneous confidence statement, and they do not turn the lower bound into a measured overlap.
The calculation is useful because it tests whether a common conceptual separation is possible. On the published estimates, the households receiving the two income types cannot be entirely separate. It does not establish the precise size or composition of the overlap.
Household income is not individual retirement status
The ACS Social Security question includes Railroad Retirement payments and survivor or disability benefits as well as retirement payments. Earnings include wages and salaries and self-employment income. Receipt is reported for the past 12 months, so the sources need not have arrived at the same time. The questionnaire defines these categories.
The tables do not establish the recipients' ages, whether anyone considers themselves retired, the adequacy of household income or the share of income each source provides. They cannot evaluate a savings program or show that older people were forced to work.
For reporting on Colorado household finances, the finding is a reason to ask about income combinations rather than divide households into workers and benefit recipients. A direct household cross-tab or microdata analysis would be needed to move from these bounds to an estimated overlap and its characteristics.
About this analysis
RetirementRiskIQ analyzed the 2025 American Community Survey 1-year detailed tables, downloaded November 2, 2026. These are survey estimates, not a census of every resident. Published margins of error and approximate derived margins use the 90% confidence level; aggregation and proportion calculations follow Census guidance and do not capture every nonsampling error. Census reports that a six-week suspension of 2025 collection affected sample size, response rates and margins of error; the published estimates are used without an invented correction. Read the collection note. Age categories do not establish retirement status. This article describes a population snapshot, not a RetirementRiskIQ risk score or personalized financial advice.
AI tools assisted the analysis code, drafting and checks. Source files, formulas, a claim ledger and chart-generation code accompany the article so another analyst can reproduce the results.
Sources, methods and downloads
The evidence archive contains frozen primary sources, their original hashes and offline calculation code for this site’s five November 2026 analyses. It preserves the source vintages and limitations described in each article.