
Public data research · 2025 source data
Rhode Island living alone figures change when households become people
By RetirementRiskIQ · Published
This descriptive source-data research is separate from the site’s modeled risk scores. It does not estimate individual risk or provide personalized financial advice. Definitions, uncertainty and source-year limits are included below.
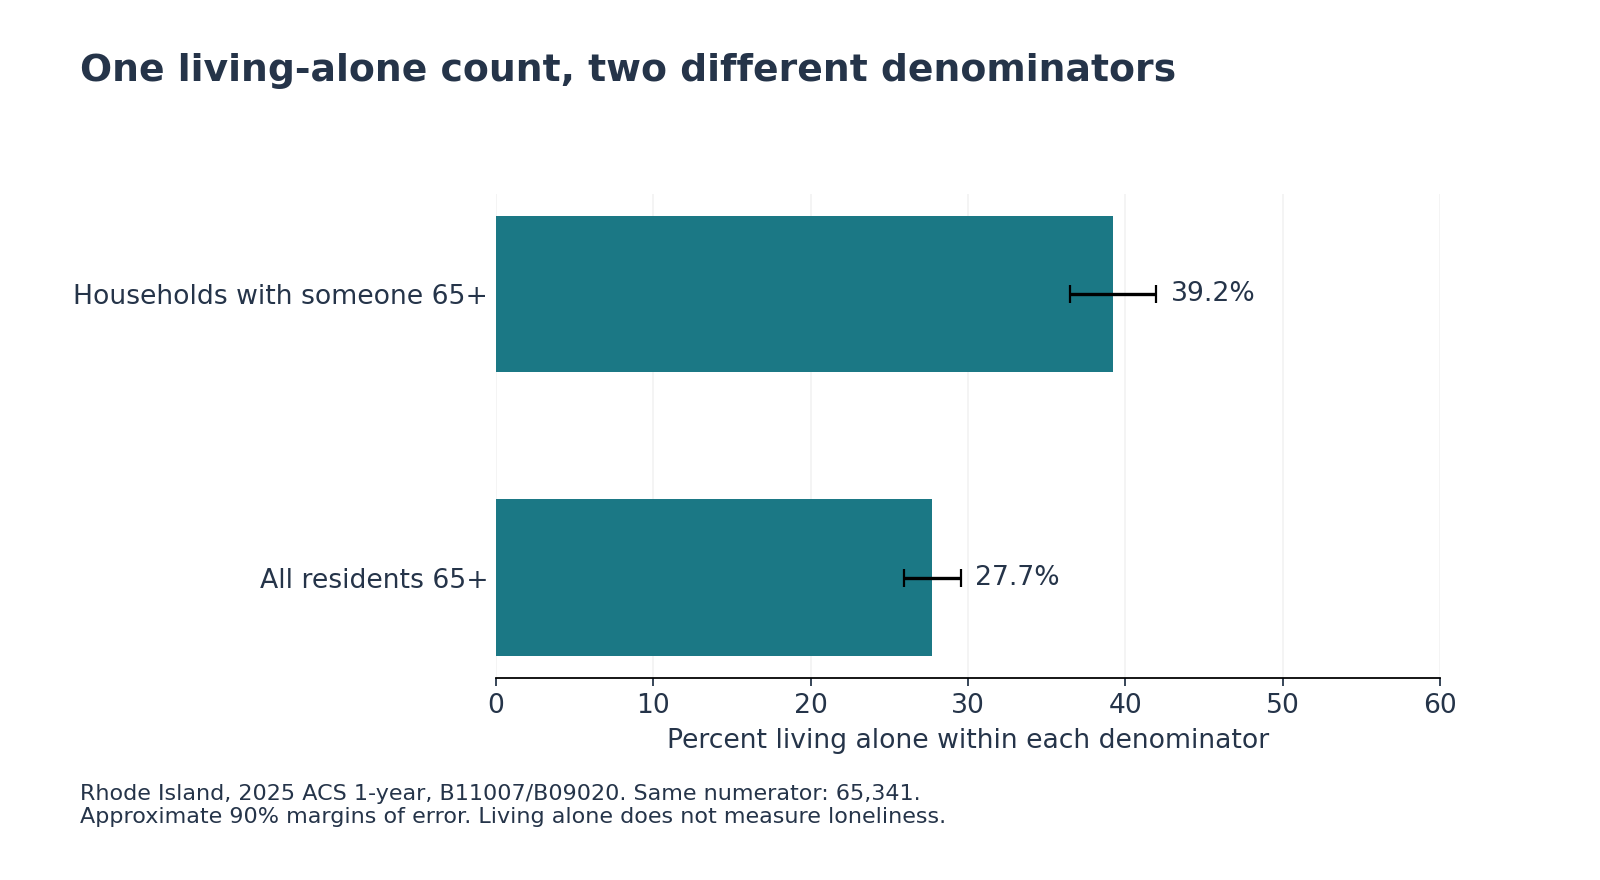
Sources, methods and downloadsAn estimated 65,341 Rhode Islanders ages 65 and older lived alone in 2025. That is 27.7% of all residents in that age range, but 39.2% of households containing an older person. Both percentages describe the same living-alone count. They answer different questions.
The distinction comes from two American Community Survey tables. One counts people; the other counts households. A person living alone contributes one unit to either denominator. A household containing more than one older person contributes multiple people but only one household. The people table also includes residents in group quarters.
The denominator changes the meaning
| Denominator | Denominator estimate | Living-alone share |
|---|---|---|
| Residents 65 and older | 235,721 ± 1,922 | 27.7% ± 1.8 percentage points |
| Households containing someone 65 or older | 166,557 ± 3,145 | 39.2% ± 2.7 percentage points |
The published person count is 235,721 Rhode Island residents ages 65 and older. The household count is 166,557 households containing at least one person in that age range. Substituting one denominator for the other would change the apparent prevalence of living alone without anyone moving house.
For a story about how many older residents live alone, the person-based 27.7% is the relevant measure. For a story about the makeup of households containing older residents, the 39.2% household figure is relevant. They should not be presented as competing estimates of the same rate or as a change over time.
Living with others is also varied
The person table places 66.3% of residents ages 65 and older in family households and 3.1% in group quarters. The remaining living arrangements include living alone and sharing nonfamily households. This is a classification of residence and relationship, not a measure of care received.
A family household can contain spouses, parents, other relatives and nonrelatives. Group quarters are a separate Census category; the table does not justify calling every resident in that category a nursing-home resident. Likewise, a person living alone may have friends, family, paid assistance or other support outside the home.
These limits matter when discussing housing and aging. The living-alone count can establish a scale for a reporting question, but it cannot count people who are lonely, need assistance, cannot afford housing or want a roommate. Those needs cannot be inferred merely from the absence of another resident.
The estimate is a state-level snapshot. It cannot locate a service gap within Providence or another municipality, evaluate an existing housing program, or identify people who would qualify for help. Interviews and more specific administrative or survey data would be needed for those questions.
The useful takeaway is practical: before repeating a statistic about older people living alone, check whether its denominator is residents or households. In Rhode Island's new estimates, that choice changes the headline percentage materially, even though the underlying living-alone count is identical.
About this analysis
RetirementRiskIQ analyzed the 2025 American Community Survey 1-year detailed tables, downloaded November 2, 2026. These are survey estimates, not a census of every resident. Published margins of error and approximate derived margins use the 90% confidence level; aggregation and proportion calculations follow Census guidance and do not capture every nonsampling error. Census reports that a six-week suspension of 2025 collection affected sample size, response rates and margins of error; the published estimates are used without an invented correction. Read the collection note. Age categories do not establish retirement status. This article describes a population snapshot, not a RetirementRiskIQ risk score or personalized financial advice.
AI tools assisted the analysis code, drafting and checks. Source files, formulas, a claim ledger and chart-generation code accompany the article so another analyst can reproduce the results.
Sources, methods and downloads
The evidence archive contains frozen primary sources, their original hashes and offline calculation code for this site’s five November 2026 analyses. It preserves the source vintages and limitations described in each article.