
Public data research · 2025 source data
Vermont employment varies across older age groups
By RetirementRiskIQ · Published
This descriptive source-data research is separate from the site’s modeled risk scores. It does not estimate individual risk or provide personalized financial advice. Definitions, uncertainty and source-year limits are included below.
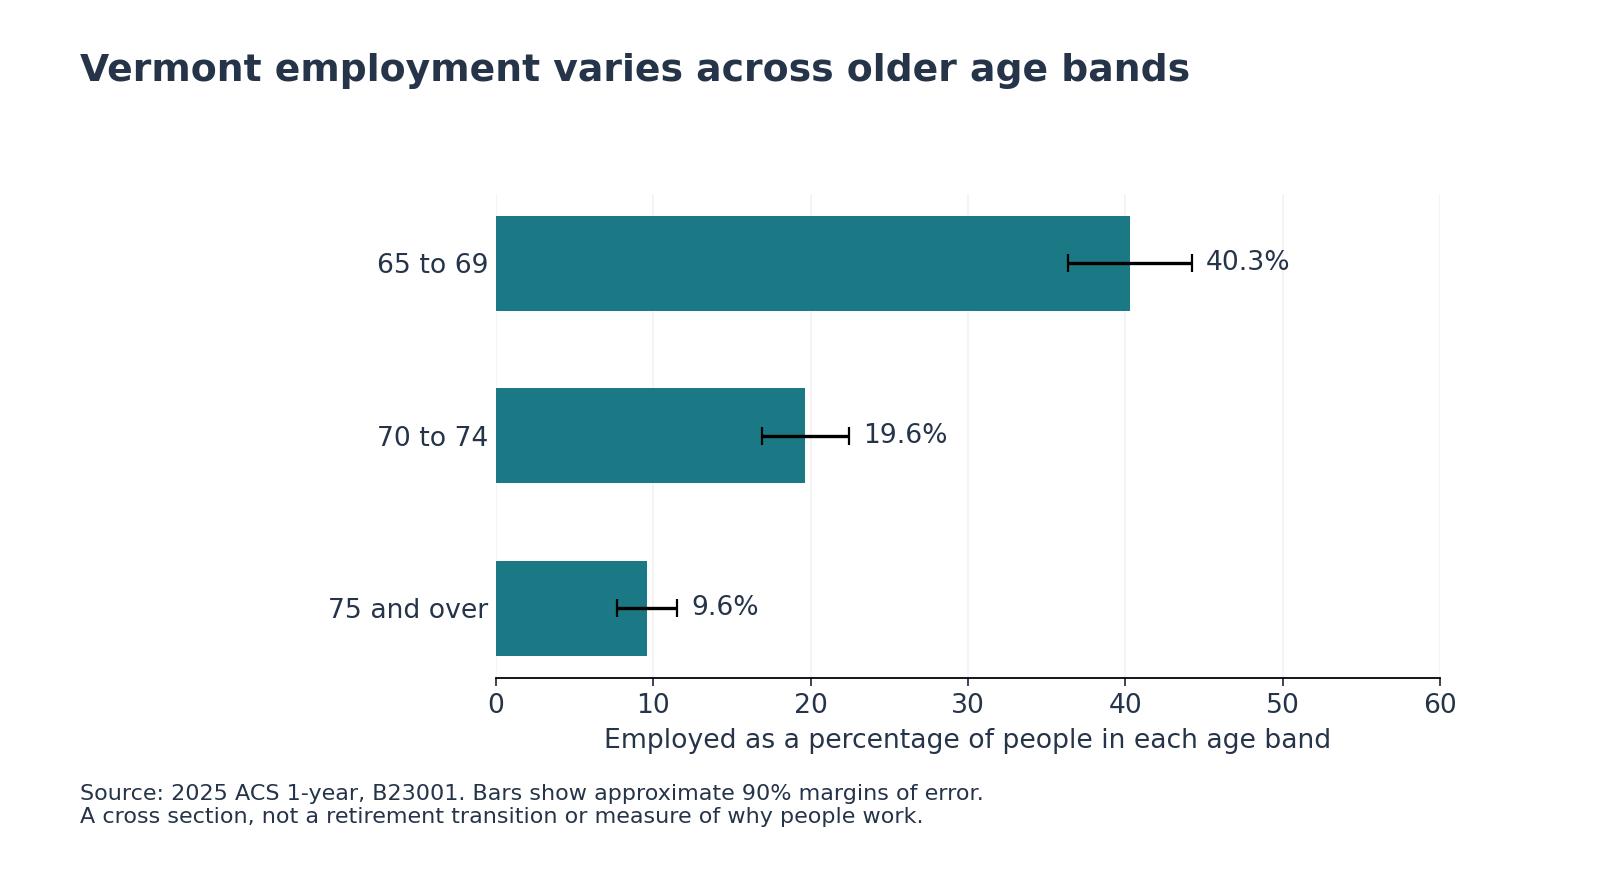
Sources, methods and downloadsAbout four in ten Vermont residents ages 65 to 69 were employed in the 2025 American Community Survey. Among residents ages 75 and older, the estimate was about one in ten. Grouping everyone past 65 under a single retirement-age label hides that difference.
The newly released 2025 Census age-by-employment table estimates 19,316 employed Vermonters ages 65 to 69, 7,992 ages 70 to 74 and 6,401 ages 75 and older. Relative to the population in each band, those figures are 40.3%, 19.6% and 9.6%. The differences are large enough that their approximate 90% uncertainty intervals do not overlap.
A workforce discussion needs an age profile
| Age | Employed people | People in age band | Employed share |
|---|---|---|---|
| 65 to 69 | 19,316 ± 2,098 | 47,955 ± 2,259 | 40.3% ± 3.9 percentage points |
| 70 to 74 | 7,992 ± 1,208 | 40,672 ± 2,242 | 19.6% ± 2.8 percentage points |
| 75 and over | 6,401 ± 1,279 | 66,679 ± 896 | 9.6% ± 1.9 percentage points |
The counts answer a different question from the percentages. Vermont had more people ages 75 and older than ages 65 to 69, yet substantially fewer employed people in the older band. A large older population does not translate proportionately into a large employed population.
For employers, community planners and reporters, the useful distinction is between the size of an age group and the share of that group currently employed. Neither alone describes the number of people available for a particular job. Employed refers to civilian employment in the survey reference week, including people temporarily absent from a job. The table does not identify occupation, working hours, willingness to change jobs or the reasons a person is working.
A cross section cannot trace a retirement decision
These are different groups observed during the same survey year, not the same people followed from their late sixties into their seventies. The figures therefore cannot show how often people retire, return to work or reduce their hours. They also cannot establish whether employment reflects preference, financial necessity, family circumstances or another reason.
The national estimates show the same age ordering: 34.5% employed at ages 65 to 69, 18.6% at ages 70 to 74 and 7.6% at ages 75 and older. That provides context, not a ranking of states or evidence that Vermont's economy caused anyone to keep working. The accompanying data preserve margins of error for both geographies.
Vermont's existing debate includes retirement-account access and the fiscal implications of an aging population. This age profile adds a narrower, directly measured question: which older age groups are part of the employed population now? It does not estimate participation in a savings program, retirement readiness or future tax revenue. Those questions require different evidence.
The distinction also matters when describing people outside employment. Someone not employed may be looking for work or outside the labor force; neither category, by itself, is an affirmative report of retirement. Calling the entire population past 65 retired would erase the workers counted here.
About this analysis
RetirementRiskIQ analyzed the 2025 American Community Survey 1-year detailed tables, downloaded November 2, 2026. These are survey estimates, not a census of every resident. Published margins of error and approximate derived margins use the 90% confidence level; aggregation and proportion calculations follow Census guidance and do not capture every nonsampling error. Census reports that a six-week suspension of 2025 collection affected sample size, response rates and margins of error; the published estimates are used without an invented correction. Read the collection note. Age categories do not establish retirement status. This article describes a population snapshot, not a RetirementRiskIQ risk score or personalized financial advice.
AI tools assisted the analysis code, drafting and checks. Source files, formulas, a claim ledger and chart-generation code accompany the article so another analyst can reproduce the results.
Sources, methods and downloads
The evidence archive contains frozen primary sources, their original hashes and offline calculation code for this site’s five November 2026 analyses. It preserves the source vintages and limitations described in each article.